Drivo Performance
Rebuilding advertising and SEO for a car rental service in New York and New Jersey. This story covers paid demand, content and analytics; AI-search visibility is documented separately in Drivo GEO.
- Period
- 4+ years working together
- Market
- New York & New Jersey, USA
- Scope
- Google Ads, paid social, SEO and analytics
- Stack
- Google Ads, Meta Ads, Google Analytics, Roistat
- ROI on digital channels
- 600%+
- Average CPL
- $20
- Website leads
- 5x
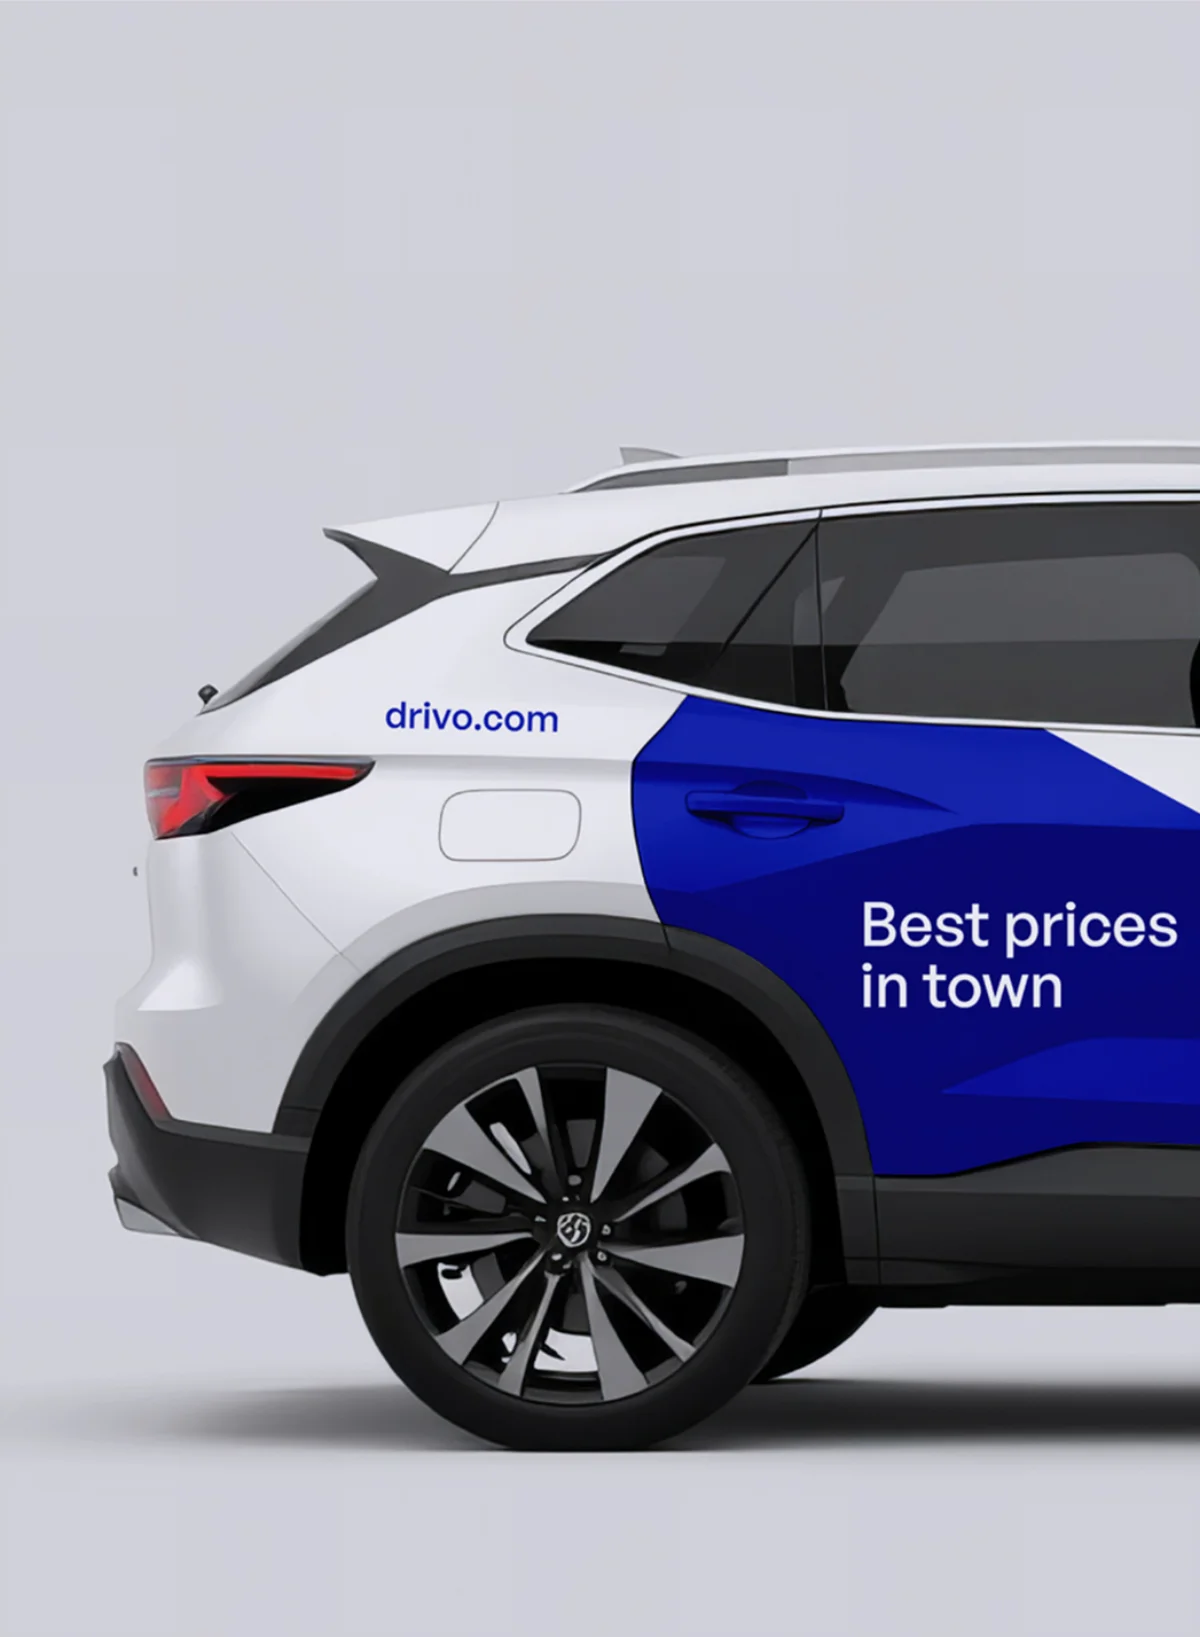
The client and the challenge
Drivo operates around Newark, JFK, LaGuardia and Brooklyn. The business wanted more online reservations and stronger recognition in a highly competitive local market.
Acquisition was expensive and measurement was fragmented. We needed to improve Google Ads and SEO while connecting traffic sources to inquiries and bookings.
Paid search
The audit revealed an unclear campaign structure, irrelevant keywords, missing negative keywords and high click costs. We regrouped keywords by intent and rebuilt campaigns around the stages of the funnel.
New ad copy emphasized relevant offers and calls to action. A/B testing, search-term analysis and ongoing budget and bid adjustments improved relevance and conversion efficiency.
The comparison below shows how the earlier structure was expanded to support discovery, acquisition, revenue and retention.
Before the rebuild
Campaigns did not separate demand stages or show a connected path from click to booking.
Mixed keywords
Different intent inside one structure
Generic ads
Low message relevance
Expensive clicks
Weak negative-keyword control
Fragmented data: Channel disconnected from bookings.
After the rebuild
The structure follows customer intent and continues measurement after the inquiry.
- 01IntentCommercial demand groups
- 02AdSpecific offer
- 03PageMatched to the search
- 04AnalyticsInquiries and bookings
- 05RetentionCRM and remarketing
Google Ads results
The published 2023–2024 comparison shows a 73% reduction in cost per lead and 5.14 times as many leads. The results below use the shared report system.
Google Ads, 2023-2024
Published paid-search comparison. Metrics from different channels are not additive.
- -73%
- cost per lead
- 5.14x
- lead volume
- +460%
- ROMI
Paid social
The previous campaigns lacked clear audience segmentation and personalized creative. We audited Facebook and Instagram, then segmented audiences by location, behavior and demographics.
Distinct creative and dynamic ads made the message more relevant to each group. Travel ideas and local content helped the brand stay useful beyond an immediate rental offer.

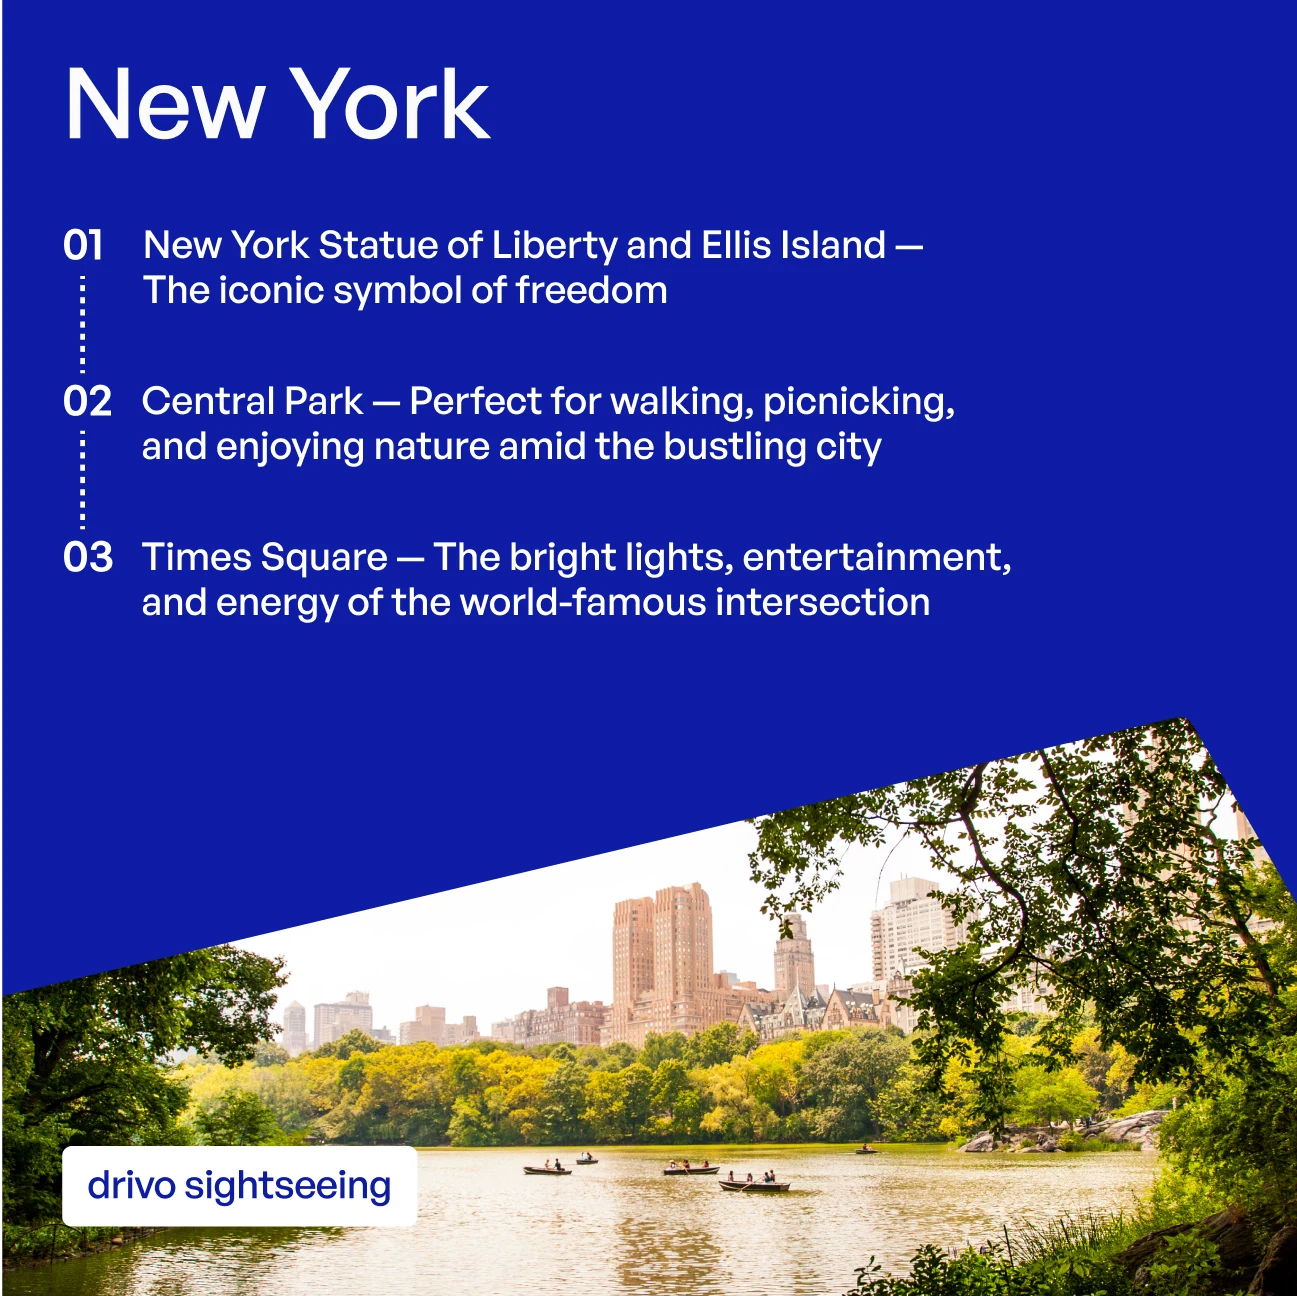
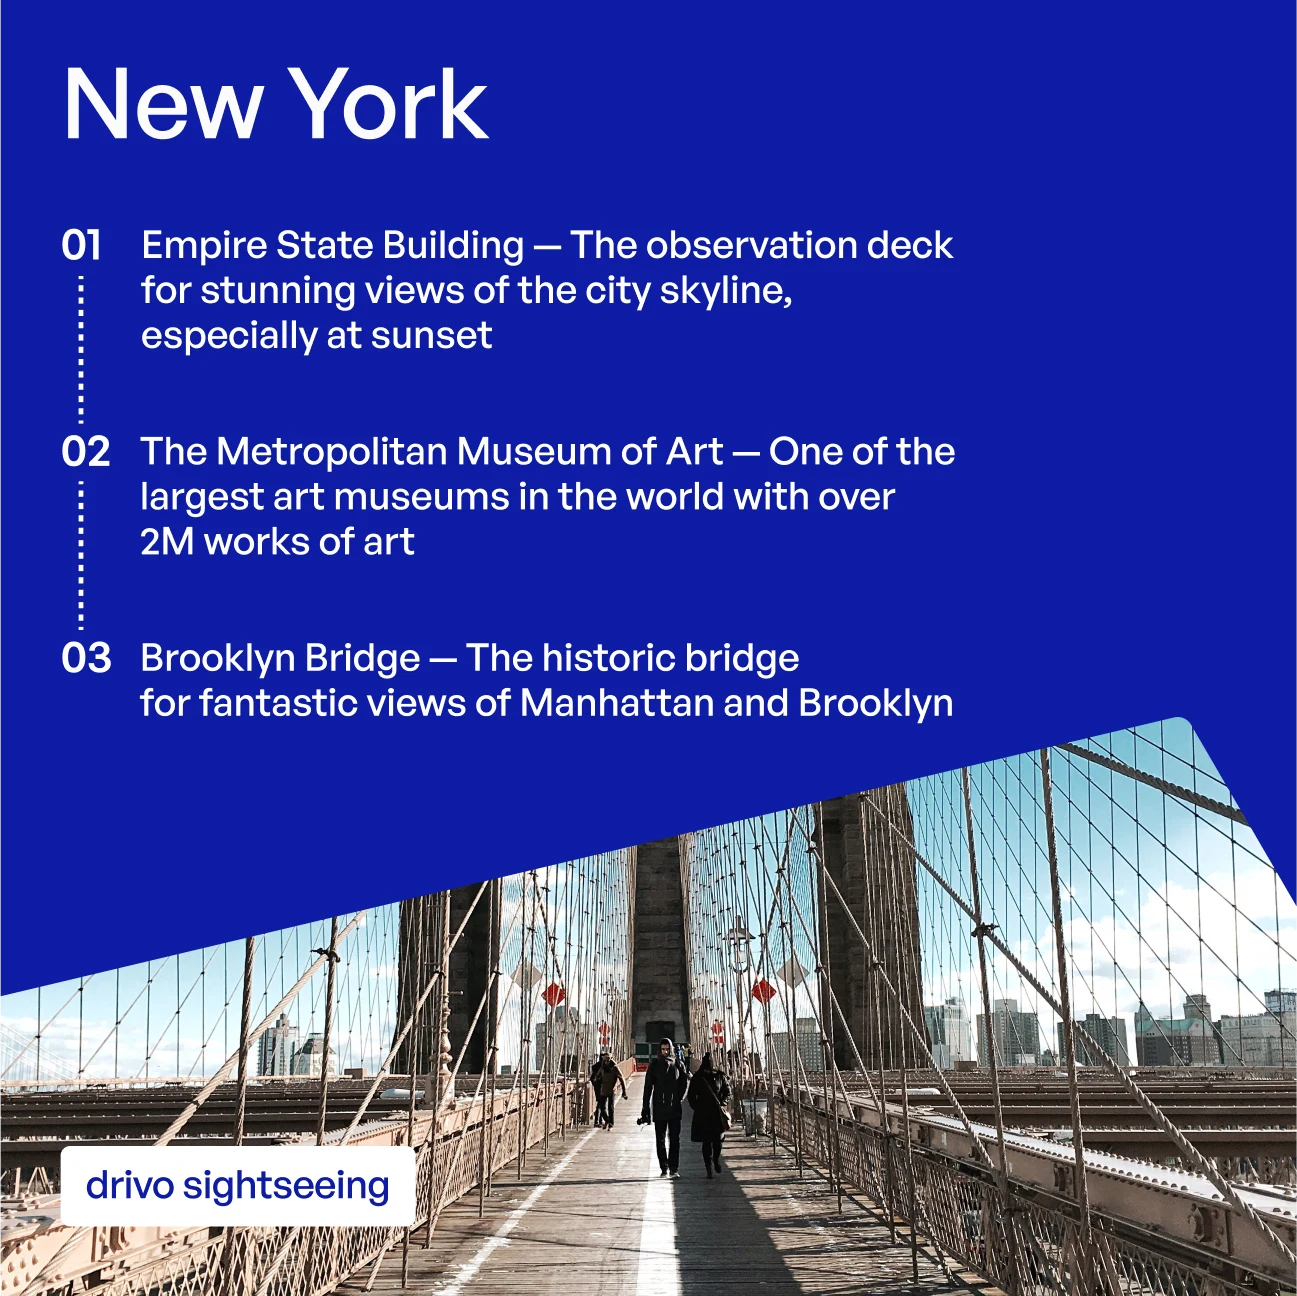
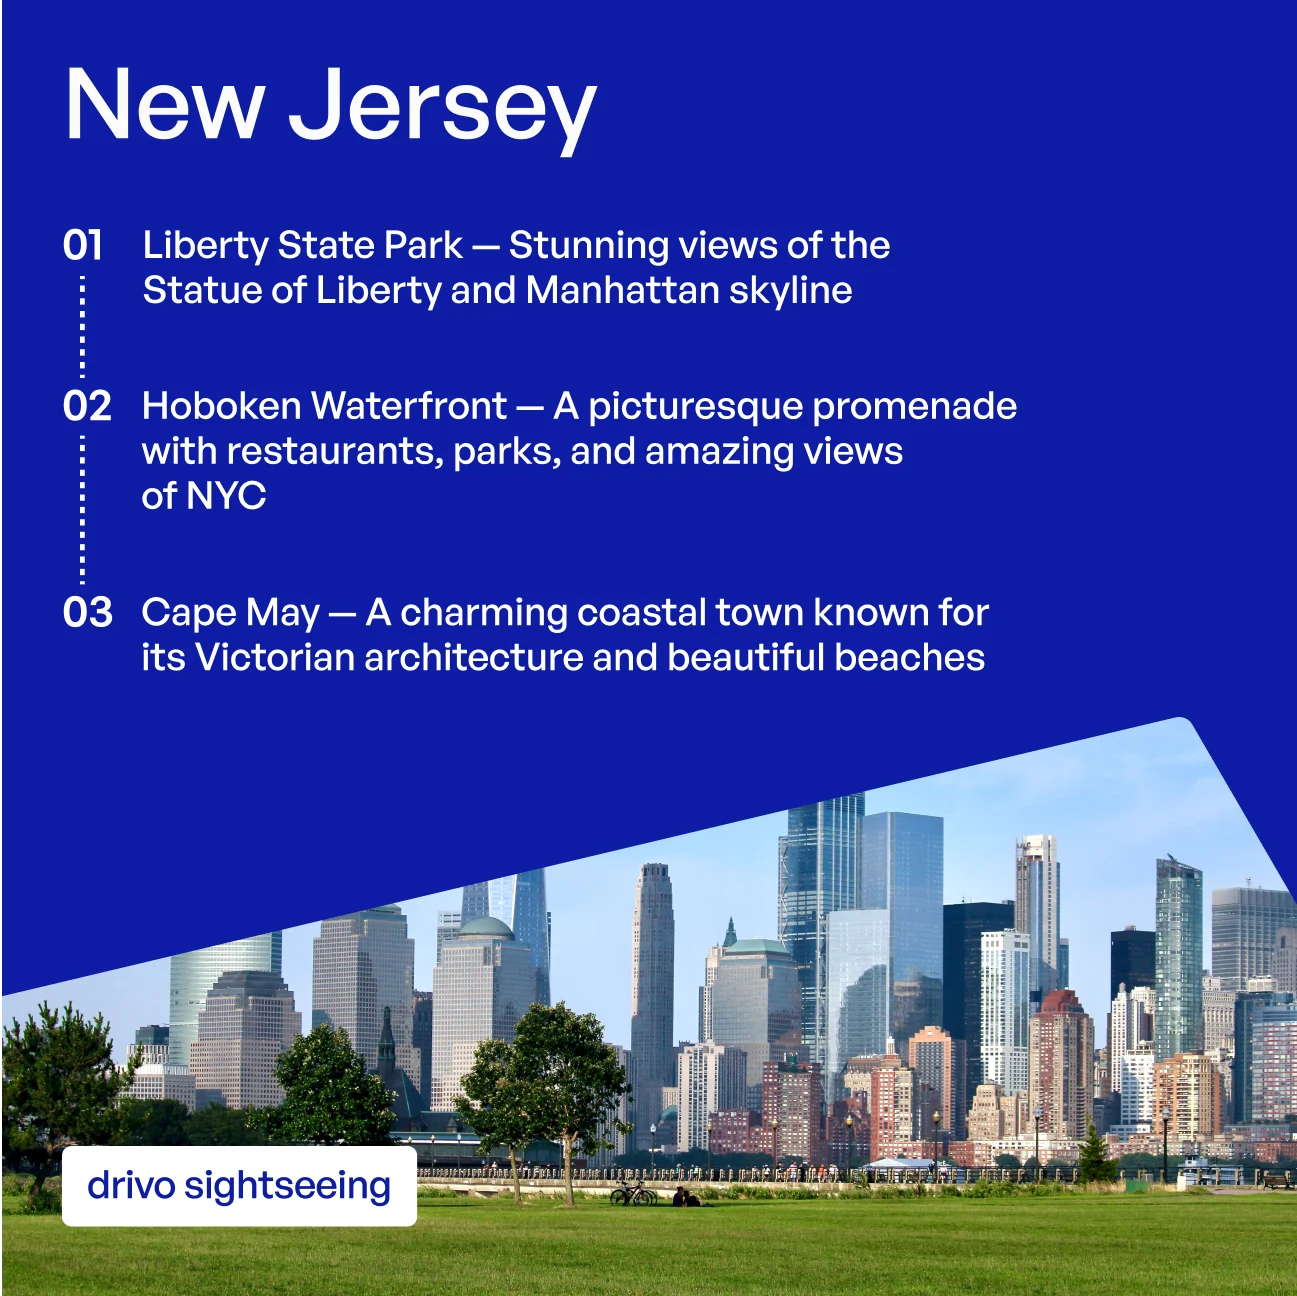
Creative, testing and optimization
Budgets were shifted toward the most effective segments, with bidding guided by conversions and return on investment. Creative production supported the channels with specific, recognizable messages.
Regular A/B testing and reporting turned campaign results into the next set of decisions. The examples below show seasonal offers, travel scenarios and rental benefits.




Paid-social results
The 2023–2024 comparison shows cost per lead falling 50% and lead volume increasing 1.83 times. Campaigns became more relevant and supported repeat interactions.
Paid social, 2023-2024
Segmentation, tailored creative and ongoing budget reallocation improved channel efficiency.
- -50%
- cost per lead
- 1.83x
- lead volume
- +275%
- ROMI
SEO: pages and local visibility
The SEO audit identified queries and pages with meaningful traffic potential. We optimized local profiles, created pages for target searches and connected the work with analytics.
The results below cover backlink development and search visibility. The published visibility comparison runs from April 2023 to November 2024.
Search visibility
The published comparison covers April 2023 through November 2024.
- 5,000+
- new backlinks
- 18.4x
- growth in search visibility
- Local
- pages for locations and airports
Content, links and analytics
Google Analytics and Roistat connected acquisition with downstream behavior. External publications and link-building supported site authority, while the blog addressed useful local and travel questions.
Internal linking connected informational content to commercial pages. Technical work covered loading speed, broken links, redirects, mobile usability, titles and metadata.
Authority and traffic results follow. Their labels and periods are retained rather than combined into a new aggregate metric.
Content, links and analytics
Source metrics and periods are preserved without combining them into a new aggregate result.
The overall result
Drivo moved from disconnected launches toward an ongoing performance-marketing system. Acquisition, follow-up and analytics could be evaluated together.
Repeat bookings became an important measure, supported by CRM and remarketing. The source comparison shows total lead volume growing 3.3 times between 2023 and 2024.
This established the foundation for later work. The separate Drivo GEO case explains the next stage: visibility and referrals from AI assistants in 2025–2026.
Overall result, 2023-2024
This comparison belongs to this stage of the engagement. Later results and AI visibility are documented separately in Drivo GEO.
The work continues
We have worked with Drivo for more than four years. The charts above document 2023–2024; later reporting reflects the next stage. Digital-channel revenue grew threefold in 2025. The AI-search visibility stage is covered in its own case.
Read Drivo GEOChart period: 2023–2024. Channel results are not additive. Original reporting labels are retained.